We have developed a data quality assessment tool that enables users with minimal data expertise to evaluate the quality of their production data quickly. The tool assesses datasets based on 41 criteria across four categories, resulting in an overall quality score with adjustable weights. It also offers explanations, visualizations, and improvement suggestions. This system simplifies the evaluation process, aids decision-making, and helps identify valuable machine learning use-cases.
| Topic Fields | |
| Published | 2022 |
| Involved Institutes | |
| Project Type | ICNAP Research/Transfer Project |
| Responsibles |
Increasing amounts of data and advances in data analytics, especially in machine learning, have the potential to make production technology more efficient. To improve human and autonomous decision-making, knowledge and information have to be extracted from data. The success of data projects heavily depends on the quality of the data, however, the evaluation is time-consuming and requires a high degree of expert knowledge.
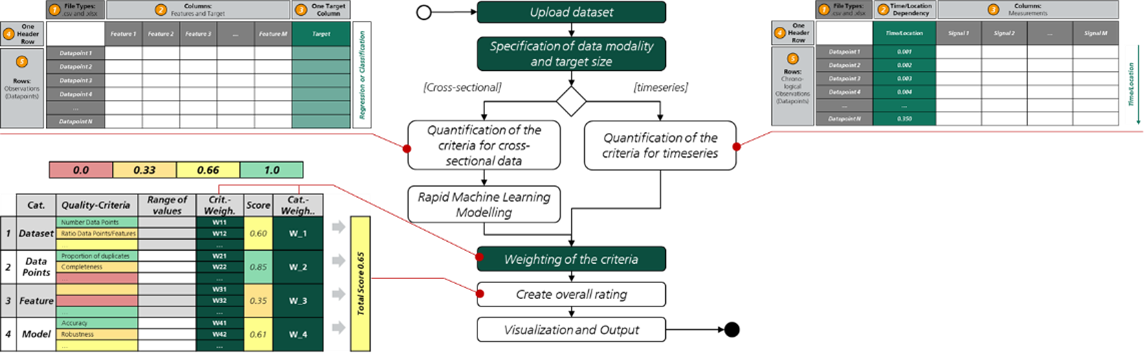
To be able to precisely estimate the success and utility of data projects during use-case selection, we developed a tool for quantifying and evaluating the quality of production data. This will enable users with little to no data expertise to rapidly assess the quality of their datasets.
The assessment system focuses on the two most common data modalities encountered in production: time series data and cross-sectional data. Datasets are evaluated according to 41 criteria divided into four categories: data set, datapoint, feature and modeling criteria. Based on the quantification of the individual features, the assessment is performed, which is then combined into an overall assessment score with customizable weighting. In addition to the assessment of the dataset, the user receives brief explanations for all criteria, various visualizations of data characteristics along with recommendations to further improve the quality of the dataset.
In summary, our data quality assessment system empowers users without knowledge of data analysis and statistics to comprehensively assess the quality of their data and creates transparency throughout the lifecycle of datasets. Moreover, it provides experts with an extensible and customizable tool for identifying profitable machine learning use-cases.
Contact us to get in touch! With a membership, you’ll gain full access to all project information and updates.
© Fraunhofer 2026